First steps with the TensorSpline API#
This example demonstrates how to create a basic interpolation using the TensorSpline API.
Data preparation#
Data type (need to provide floating numbers, “float64” and “float32” are typical). Create random data samples and corresponding coordinates.
import numpy as np
import matplotlib.pyplot as plt
from splineops.interpolate.tensorspline import TensorSpline

dtype = "float32"

nx, ny = 2, 5
xmin, xmax = -3.1, +1
ymin, ymax = 2, 6.5
xx = np.linspace(xmin, xmax, nx, dtype=dtype)
yy = np.linspace(ymin, ymax, ny, dtype=dtype)
coordinates = xx, yy
prng = np.random.default_rng(seed=5250)
data = prng.standard_normal(size=tuple(c.size for c in coordinates))
data = np.ascontiguousarray(data, dtype=dtype)
TensorSpline setup#
Tensor spline bases and signal extension modes.
bases = "bspline3"  # same basis applied to all dimensions
modes = "mirror"  # same mode applied to all dimensions

tensor_spline = TensorSpline(
    data=data, coordinates=coordinates, bases=bases, modes=modes
)
Evaluation coordinates#
Create evaluation coordinates (extended and oversampled in this case).
Next, there are three equally valid ways to do interpolation evaluation:
1) Standard evaluation#
Perform a standard evaluation on a grid of coordinates.
eval_coords = eval_xx, eval_yy
data_eval = tensor_spline(coordinates=eval_coords)
2) Meshgrid evaluation#
Evaluate using a meshgrid (not the default choice but could be useful in some cases).
eval_coords_mg = np.meshgrid(*eval_coords, indexing="ij")
data_eval_mg = tensor_spline(coordinates=eval_coords_mg, grid=False)
np.testing.assert_equal(data_eval, data_eval_mg)
3) Points evaluation#
Evaluate the tensor spline at a list of points directly.
eval_coords_pts = np.reshape(eval_coords_mg, (2, -1))
data_eval_pts = tensor_spline(coordinates=eval_coords_pts, grid=False)
np.testing.assert_equal(data_eval, np.reshape(data_eval_pts, data_eval_mg.shape))
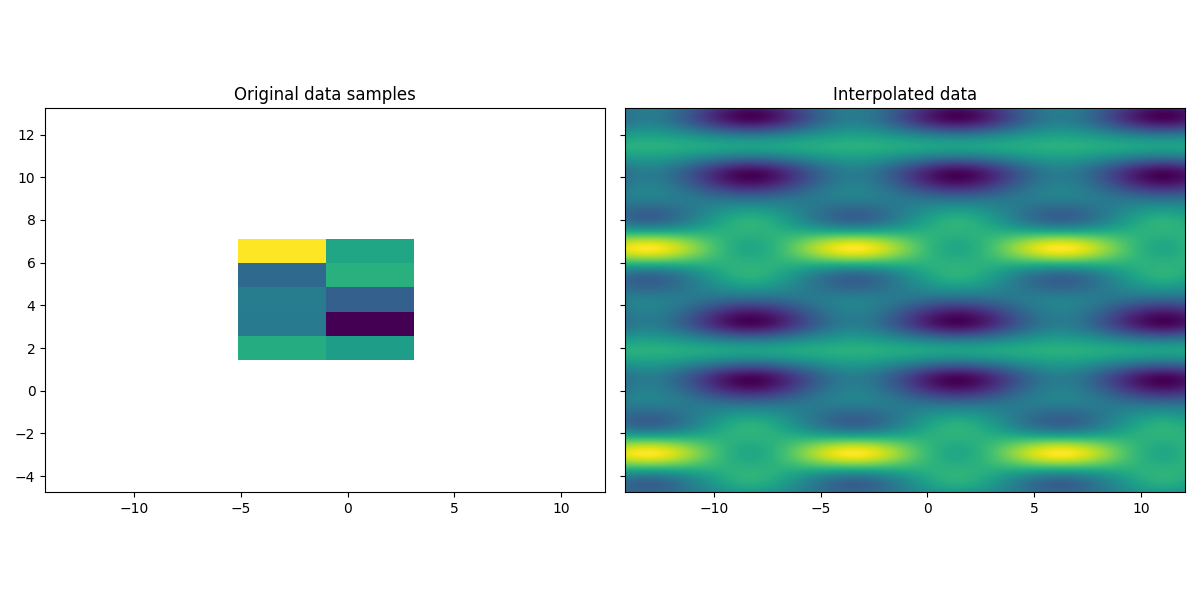
Visualization#
Visualize the original data samples and the interpolated data.
fig: plt.Figure
ax: plt.Axes

extent = [xx[0] - dx / 2, xx[-1] + dx / 2, yy[0] - dy / 2, yy[-1] + dy / 2]
eval_extent = [
    eval_xx[0] - dx / 2,
    eval_xx[-1] + dx / 2,
    eval_yy[0] - dy / 2,
    eval_yy[-1] + dy / 2,
]

fig, axes = plt.subplots(nrows=1, ncols=2, figsize=(12, 6), sharex="all", sharey="all")
ax = axes[0]
ax.imshow(data.T, extent=extent)
ax.set_title("Original data samples")
ax = axes[1]
ax.imshow(data_eval.T, extent=eval_extent)
ax.set_title("Interpolated data")

plt.tight_layout()
plt.show()

Total running time of the script: (0 minutes 0.304 seconds)
