
Benchmarks#
Compare accuracy, speed, and memory on reproducible workloads. Start with the performance report for practical trade-offs, or choose a study below to see how the methods behave on a particular kind of data.

Compare complete workflows, reusable plans, native acceleration, and memory use. Includes workloads where another method is faster.
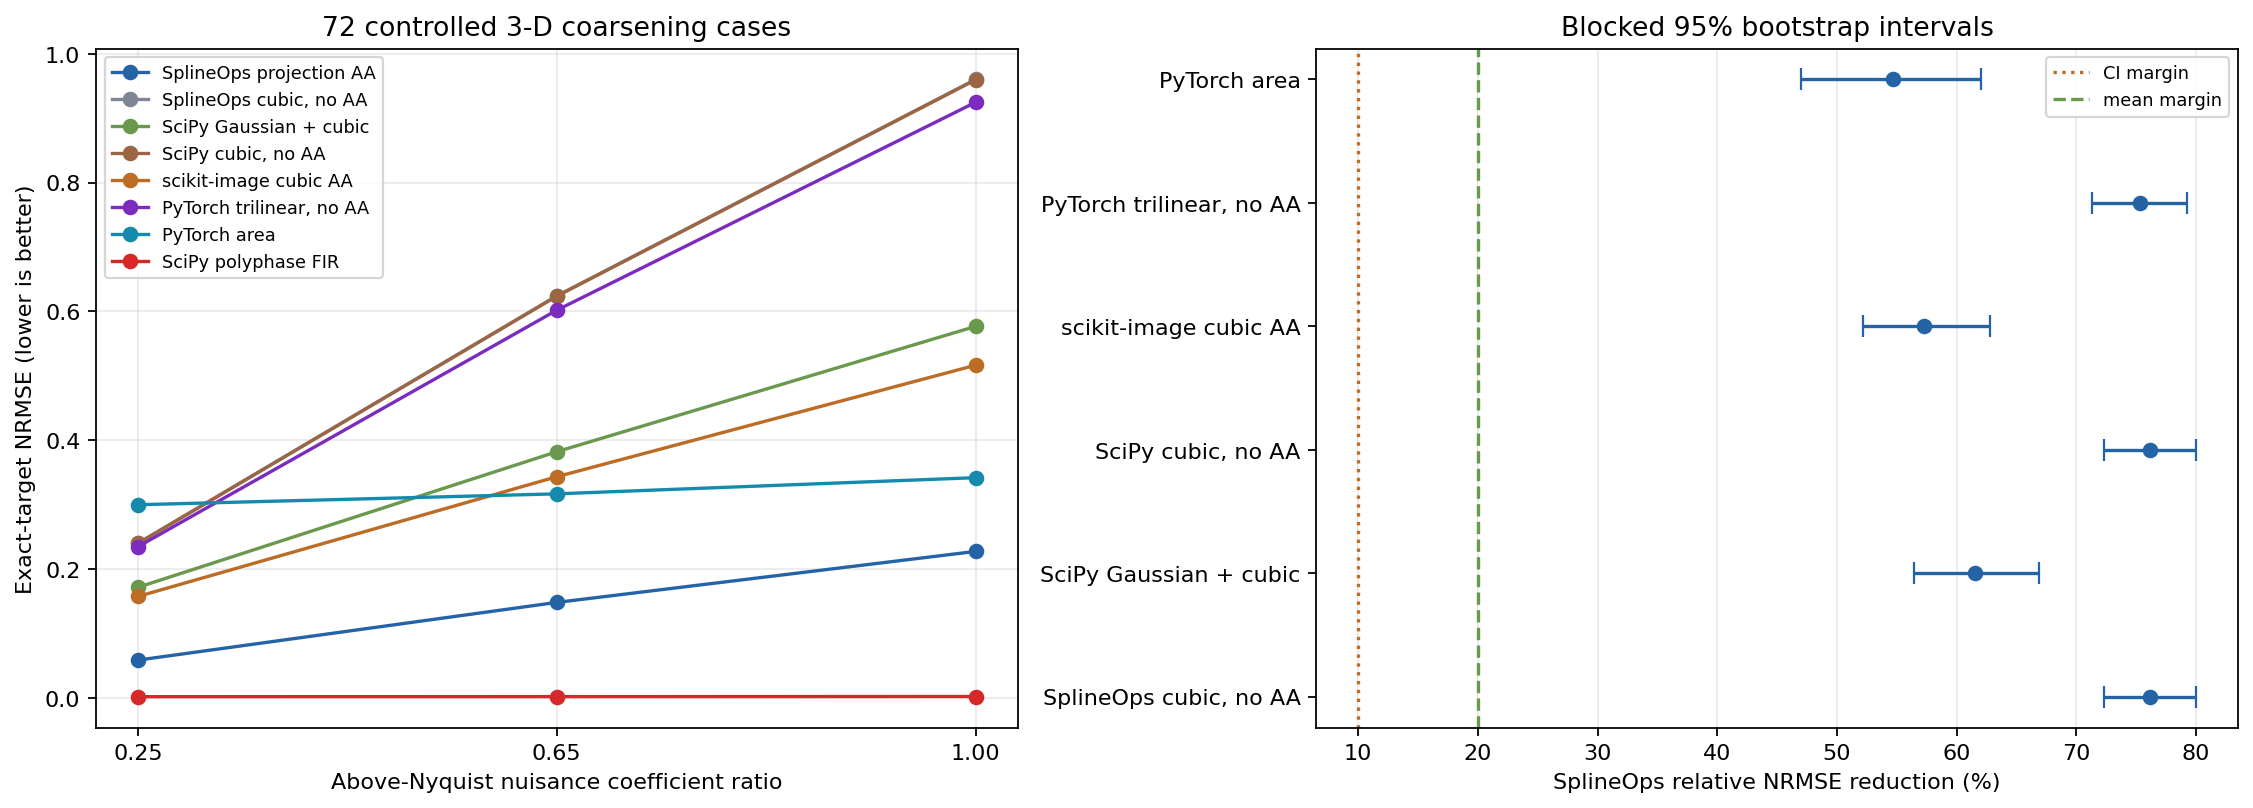
Measure resampling error against an analytical target, including the stronger polyphase reference added after the original study.
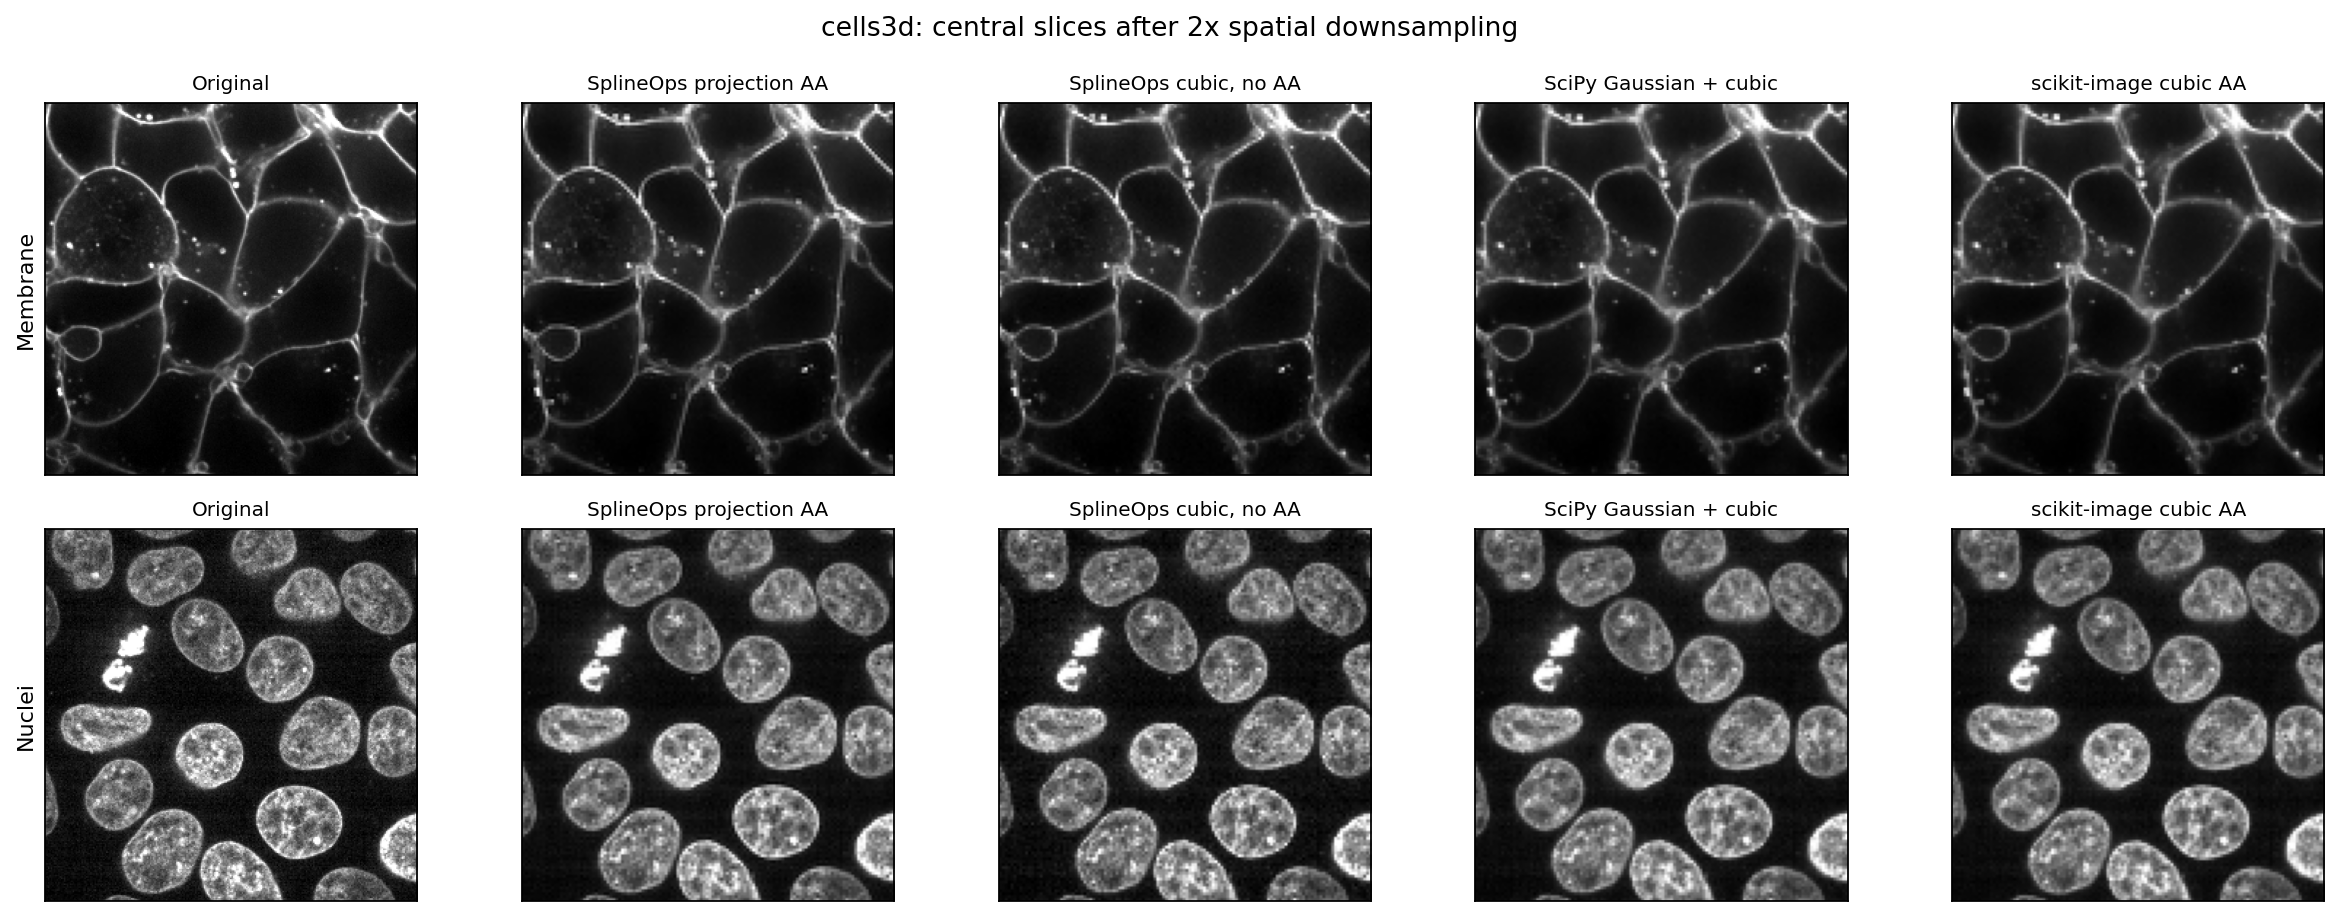
Inspect a two-channel volume and compare visual detail, accuracy metrics, and local runtime.
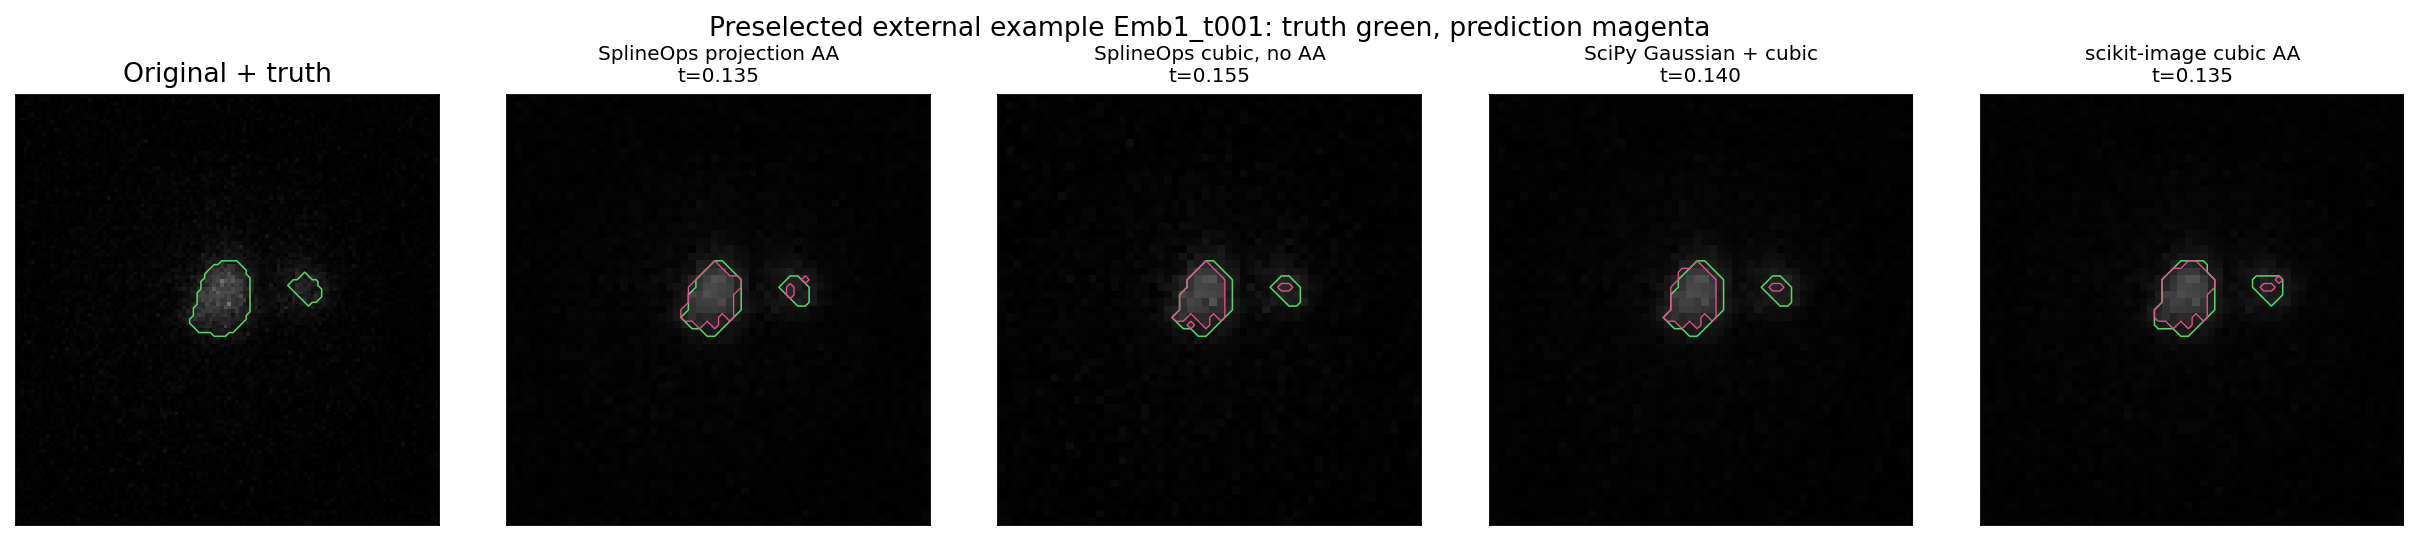
Check downstream results against manual labels. This study did not meet its predeclared quality-superiority criterion.
Microvessel case study#
The 3-D microvessel quality-at-speed validation compares named downsampling pipelines on 18 held-out labelled 3-D patches. It reports a specific quality-and-speed result for voxel ranking; it does not establish segmentation superiority. Use the Interactive SELMA3D comparison to explore one patch interactively in napari.
Reproduce and interpret the results#
Each report records its data, geometry, methods, environment, and limitations. Timings are machine-dependent. Coordinate and boundary conventions must match before an output difference can be interpreted as numerical error.
For a concise record of what the studies support, see Claims and evidence. For numerical API guarantees and tested configurations, see API stability and support and Backend support contract.