Spline bases#
Plotting the spline bases of the library.
Imports and Utilities#
Define a helper function to visualize the spline bases.
import numpy as np
import matplotlib.pyplot as plt
from splineops.bases.utils import create_basis

x_values = np.linspace(-3, 3, 1000)

def plot_bases(names, x_values, title):
    plt.figure(figsize=(12, 6))
    for name in names:
        if name == "keys":
            readable_name = "Keys Spline"
        else:
            name_parts = name.split("-")
            readable_name = f"{name_parts[0][:-1]} degree {name_parts[0][-1]}"
        y_values = create_basis(name).eval(x_values)
        plt.plot(x_values, y_values, label=readable_name)

    plt.title(title)
    plt.xlabel("x")
    plt.ylabel("y")
    plt.grid(True)
    plt.legend()
    plt.show()
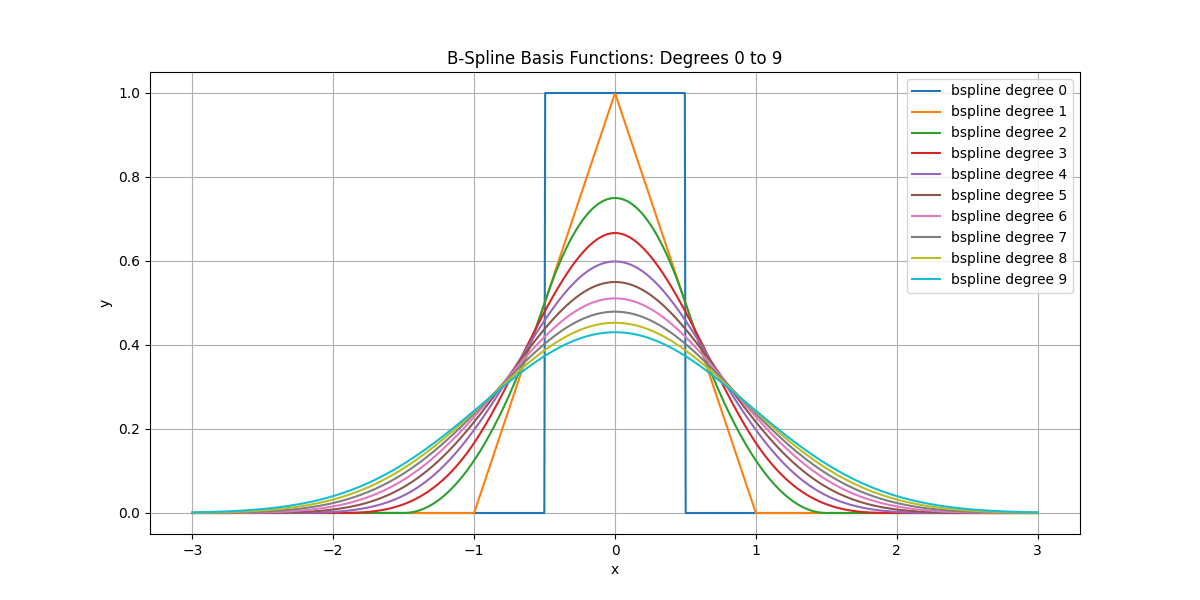
Plot B-Spline Bases#
Plot B-spline basis functions for degree 0 to 9.
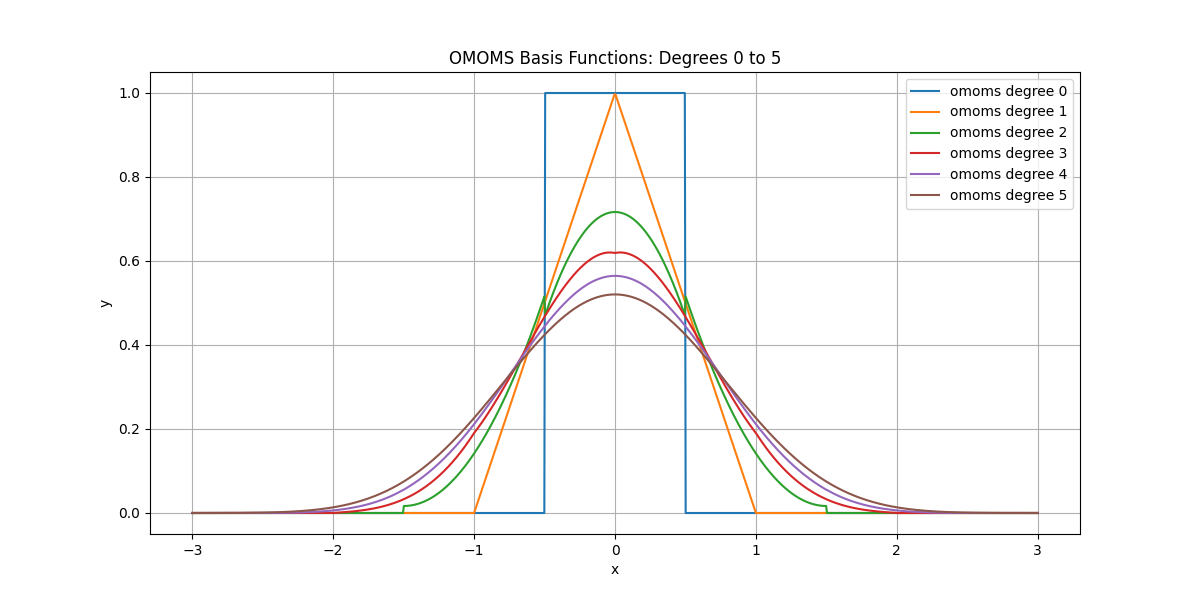
Plot OMOMS Bases#
Plot OMOMS basis functions for degree 0 to 5.
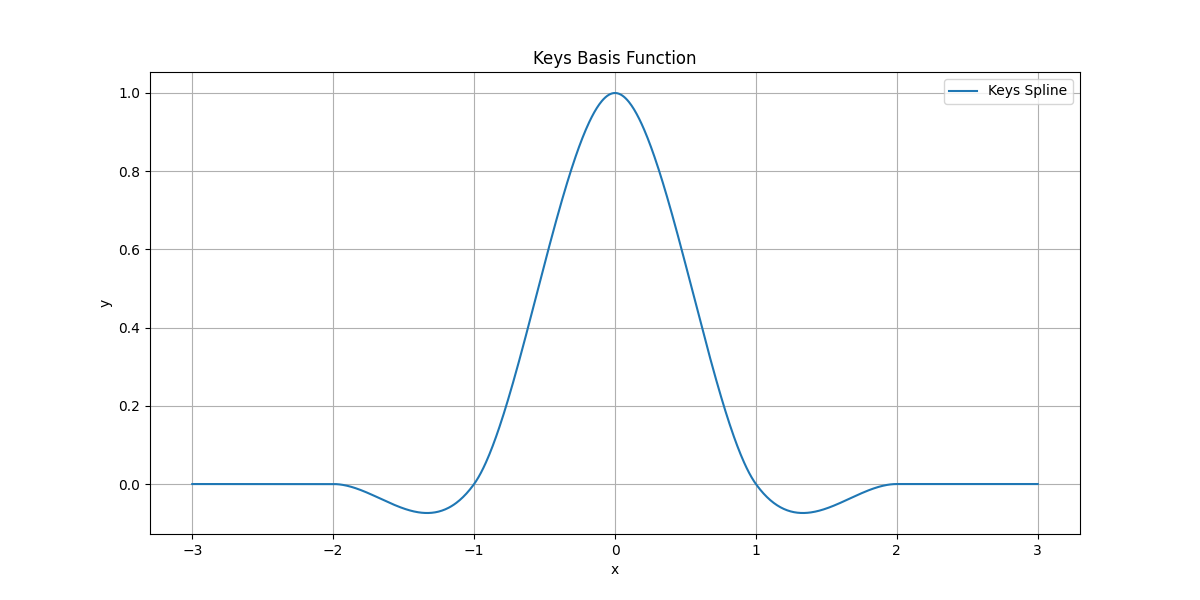
Plot Keys Basis#
Plot the Keys basis function.
Total running time of the script: (0 minutes 0.281 seconds)