2D Image Smoothing#
We use the smooth module to smooth a 2D image.
Imports#
import numpy as np
import matplotlib.pyplot as plt
from splineops.denoise.smoothing_spline import smoothing_spline_nd
2D Image Smoothing#
import requests
from io import BytesIO
from PIL import Image

def create_image():
    """
    Loads a real grayscale image.
    """
    url = 'https://r0k.us/graphics/kodak/kodak/kodim06.png'
    response = requests.get(url)
    img = Image.open(BytesIO(response.content))
    data = np.array(img, dtype=np.float64)
    data /= 255.0  # Normalize to [0, 1]

    return data

def add_noise(img, snr_db):
    """
    Adds Gaussian noise to the image based on the desired SNR in dB.
    """
    signal_power = np.mean(img ** 2)
    sigma = np.sqrt(signal_power / (10 ** (snr_db / 10)))
    noise = np.random.randn(*img.shape) * sigma
    noisy_img = img + noise
    return noisy_img

def compute_snr(clean_signal, noisy_signal):
    """
    Compute the Signal-to-Noise Ratio (SNR).

    Parameters:
    clean_signal (np.ndarray): Original clean signal.
    noisy_signal (np.ndarray): Noisy signal.

    Returns:
    float: SNR value in decibels (dB).
    """
    signal_power = np.mean(clean_signal ** 2)
    noise_power = np.mean((noisy_signal - clean_signal) ** 2)
    snr = 10 * np.log10(signal_power / noise_power)
    return snr

def demo_image():
    # Parameters
    lambda_ = 0.1  # Regularization parameter
    gamma = 2.0     # Order of the spline operator
    snr_db = 10.0   # Desired SNR in dB

    # Load image
    img = create_image()
    noisy_img = add_noise(img, snr_db)
    smoothed_img = smoothing_spline_nd(noisy_img, lambda_, gamma)

    # Compute SNRs
    snr_noisy = compute_snr(img, noisy_img)
    snr_smooth = compute_snr(img, smoothed_img)
    snr_improvement = snr_smooth - snr_noisy

    print("Image:")
    print(f"SNR of noisy image: {snr_noisy:.2f} dB")
    print(f"SNR after smoothing: {snr_smooth:.2f} dB")
    print(f"SNR improvement: {snr_improvement:.2f} dB\n")

    # Visualization for image
    plt.figure(figsize=(12, 4))
    plt.subplot(1, 3, 1)
    plt.imshow(img, cmap='gray')
    plt.title('Original Image')
    plt.axis('off')

    plt.subplot(1, 3, 2)
    plt.imshow(noisy_img, cmap='gray')
    plt.title(f'Noisy Image (SNR={snr_noisy:.2f} dB)')
    plt.axis('off')

    plt.subplot(1, 3, 3)
    plt.imshow(smoothed_img, cmap='gray')
    plt.title(f'Smoothed Image (SNR={snr_smooth:.2f} dB)')
    plt.axis('off')

    plt.tight_layout()
    plt.show()

# Run the image demo
demo_image()
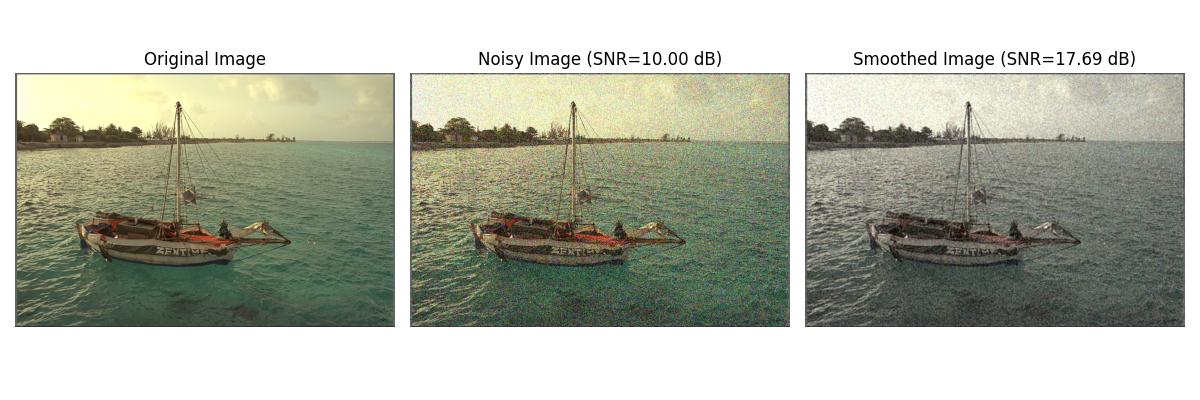
Image:
SNR of noisy image: 10.00 dB
SNR after smoothing: 17.69 dB
SNR improvement: 7.69 dB

Clipping input data to the valid range for imshow with RGB data ([0..1] for floats or [0..255] for integers). Got range [-0.6702387206030012..1.76025280954446].
Clipping input data to the valid range for imshow with RGB data ([0..1] for floats or [0..255] for integers). Got range [-0.09837255519596473..1.1837520472210685].
Total running time of the script: (0 minutes 1.474 seconds)